Line Monitoring System

The line monitoring system visualizes all line events, performance data and OEE in real time! Improve your production effectiveness (OEE) through quick and tailor-made corrective measures based on data, facts and event transparency!

LMS

LMS - real-time line overview

All production lines at a glance! The LMS overview monitor includes the current OEE in individual traffic light colors, the production quantities of the active order, a meaningful status bar and a progress bar for each line! The real-time line overview can be called up on any PC.

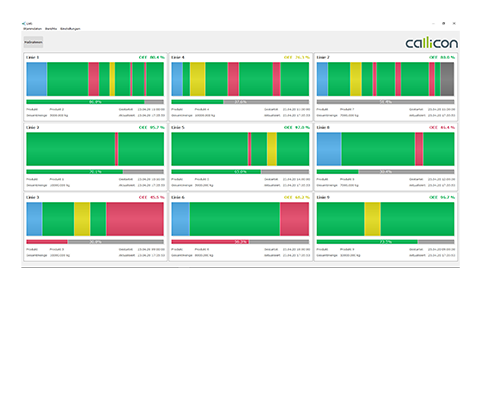
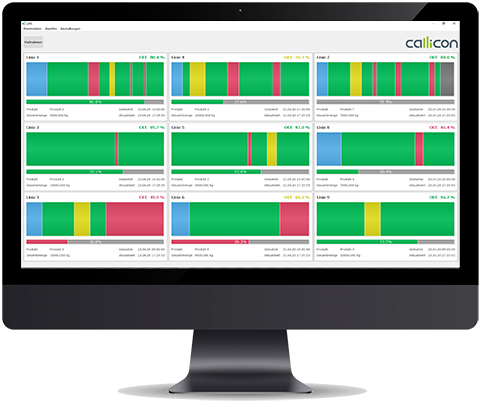
LMS - real-time line visualization

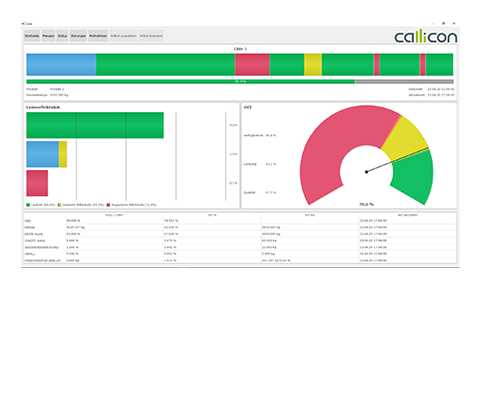
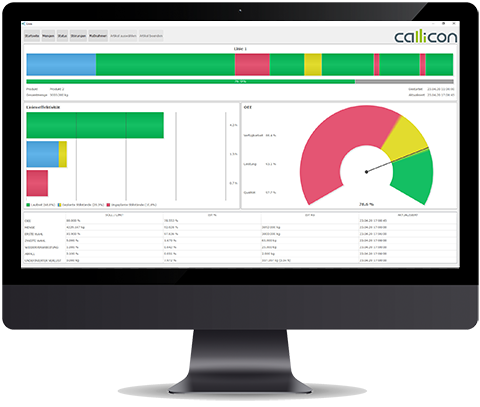
An informative line monitor shows all important data on any PC. A colored status bar, OEE speedometer, a bar chart and a table give you maximum transparency! The status bar is made up of production times, downtimes, breaks and set-up times. All important target and actual data such as production quantities, rejects, etc. complete the picture!

Production data and fault recording

All production data with all important parameters is conveniently recorded directly on the line or on the nearest PC. This includes production quantities, status reports and malfunctions. An individually configurable fault tree is available for high-quality, evaluable fault recording.

Automated data collection

By connecting machine controls or additional sensors, it is possible to record data automatically. We will examine the connectivity options for your systems together with you on site and work out a reliable offer.

Recording of measures and ideas

Thanks to the central recording of measures and ideas, measures, actions and ideas can be recorded anytime and anywhere! Measures can be linked to a product, a line or in combination! To top it off, you can define a completion date! The list of measures is the central tool for maintaining and tracking all improvement and corrective measures!

Order-related production reports

After completing a production order, a production order report is automatically created and saved in PDF format. This not only graphically shows the status bar of the entire production time, but also the final OEE speedometer and all target values - and actual production quantities.

Production statistics

All completed production orders are listed so that they can be evaluated. Multiple filter functions for all parameters enable an effective focus on specific lines, orders, products and date ranges. Thanks to the practical CSV export function, all evaluations can be created quickly and conveniently according to your requirements.

Failure analysis - failure report

Due to the high data quality of the fault recording, all downtimes can be individually filtered. This makes the greatest challenges on the production lines clear and you can fully exploit your potential!

Action List - Follow Up Actions

The list of measures can be called up from any PC. With extensive filter functions, the list can be filtered for your areas of responsibility and efficiently viewed and edited in meetings. All important parameters provide information about the completion status of all created measures and tasks.